If you send an email out into the wild and don’t review the metrics, did it really happen?
Of course it did! But it does make it difficult to know what kind of impact your email had. Did a lot of subscribers open it? Did they click any links? Did they make a purchase as a result?
To answer these questions and discover if your emails are helping you connect with customers and grow your business, know which email marketing metrics also known as key performance indicators (or KPIs) to look for and why they are essential.
An email open rate measures the number of people who opened your messages.
Why do you need to measure open rates?
Your open rate can provide several insights into your email’s overall performance, including whether your subject lines are effective and the best times to email subscribers.
If your open rates aren’t as high as you want them to be, there are simple steps you can take to try to improve them.
For example, try emphasizing urgency in your subject lines to make them more compelling. Or, add specific details that tell subscribers exactly what they’ll get in your emails. Your goal is to stand out in the inbox, so you need to convince subscribers that your content is worth engaging with.
Low open rates could also mean that you’re not sending emails at an ideal time for your subscribers. Try sending your emails on different days and times.
With this insight, you can identify how you can get more people to view your emails.
How to calculate email open rates?
Open rates are calculated by taking the unique opens (i.e., the total number of unique subscribers who open your email) and dividing it by the total number of delivered emails.
Open rate calculation examples
If you send an email and it’s delivered to 1,000 subscribers and 300 of them open it, you would have a 30% open rate.
An email click-through rate measures the number of people who click on links or call to actions in your messages based on the number of people the email was delivered to.
Why do you need to measure click-through rates?
Your email click-through rate tells you whether or not your email content and call to action is relevant to your subscribers.
If you find your subscribers are opening your emails but not clicking the links within them, there are a few actions you can take to fix this issue.
For example, try different types of content. As you experiment with different types of content, make note of what works and what doesn’t. Create an email content calendar and keep track of the things your subscribers love most.
It’s also possible your low CTR is due to your call to action (CTA). Start testing different CTA copy to see if one works better than the other.
The insight you gain from your click-through rate metrics can help you optimize the content of your emails.
How to calculate email click-through rates?
Click-through rates are calculated by taking the total unique clicks (i.e., the total number of unique subscribers who clicked on a link in your email) and dividing it by the total number of delivered emails.
Click-through rate example
If you send an email to 1,000 subscribers and 80 of them click on a link in it, you would have an 8% click-through rate.
An email click-to-open rate measures the number of people who click on links or call to actions in your messages based on the number of people who opened the email.
Why do you need to measure click-to-open rates?
To explain why you need to measure click-to-open rates, it helps to understand how click-to-open rates are different from click-through rates. Click-through rates divide unique clicks by the total number of emails delivered, where click-to-open rates divide clicks by unique opens.
Why is this significant? Because it takes those subscribers who didn’t open out of the equation. Now you’re looking at people who actually viewed your content. So now you can start identifying the impact of your content and call to actions in a silo.
How to calculate email click-to-open rates?
Click-to-open rates are calculated by taking the total unique clicks (i.e., the total number of unique subscribers who clicked on a link in your email) and dividing it by the total number of unique opens.
Click-to-open rate example
If 500 subscribers open your email and 150 of them click on a link in it, you would have a 30% click-to-open rate.
Email sales is the amount of money generated from an email
Sales are tracked by identifying who read an email and clicked through to your site and made a purchase.
Why do you need to measure sales from emails?
This ones pretty obvious – so you know how much money you make from your email marketing efforts.
Conversion rate
What are email conversion rates?
Your conversion rate is the percentage of subscribers who complete a goal from your email campaign.
Why do you need to measure conversion rates from emails?
This is a very important email marketing kpi because it indicates how effective your campaign is performing.
Your conversion rate can be influenced by several factors:
Email segmentation – are you sending the right offer to the right subscribers?
Call-to-action (CTA) – is the CTA in your email direct? Are you using action terms?
Landing page – is your landing page optimized to get the visitor to take a desired action?
How to calculate conversion rates?
Email conversion rates are calculated by taking the number of conversions (subscribers who completed the desired goal) and dividing that number by the total number of emails delivered.
Conversion rate example
If you send an email which is delivered to 1,000 subscribers and 5 of them completed your goal (conversion), then you would have a conversion rate of 5%.
Email unsubscribe rate is the percentage of people who clicked on the opt-out link in a given email.
Why do you need to measure unsubscribe rates?
It’s a sad moment when you discover someone has unsubscribed from your email list. But it’s important to look at your unsubscribers from a new angle that seeks to understand the reasons why they left, and what you could do better to bring them back or prevent others from leaving.
How to calculate email unsubscribe rates?
Unsubscribed rate is calculated by dividing the total number of people who unsubscribed by the total number of emails delivered.
Unsubscribe rate example
If you send 1,000 emails and 10 people unsubscribe then your unsubscribe rate would be 1%.
A soft bounce means a recipient’s email account is temporarily unavailable. This typically happens when a server is unavailable or a recipient’s inbox is full.
Most email marketing providers will continue to send to a soft bounce several times before automatically unsubscribing them from your email list.
How to calculate soft bounce rates?
Soft bounce rates are calculated by taking the total number of soft bounces and dividing it by the total number of emails sent.
Hard bounce
What is an email hard bounce?
A hard bounce means a recipient’s email account is closed or invalid. Most email marketing providers will automatically unsubscribe someone who hard bounces.
How to calculate hard bounce rates?
Hard bounce rates are calculated by taking the total number of hard bounces and dividing it by the total number of emails sent.
Delivery rate
What is an email delivery?
The receiving mail server accepted the email and delivered it to the mailbox. However, just because an email is “delivered”, does not mean that it reached your recipient’s inbox.
Your email delivery rate is the opposite of your bounce rate. If an email does not bounce then it is considered delivered.
Why do you need to measure delivery rates?
If you find that your email open rates are unusually low and spam complaints are high, there may be an issue with deliverability, which influences whether or not your emails make it into your subscribers’ inboxes.
There are several factors that influence the deliverability of your emails, but the best way to maintain a good email deliverability rate is by adhering to the CAN-SPAM Act and email marketing best practices.
According to the CAN-SPAM Act, a U.S. law that regulates commercial emails, senders must:
Include a way for subscribers to unsubscribe
Contain the sender’s valid postal address
Be clear about who is sending the email
Label the message as an advertisement
Avoid misleading subject lines
How to calculate delivery rates?
Delivery rate is calculated by dividing the number of emails sent by the number of emails delivered.
Delivery rate example
If you send 1,000 emails and 950 were delivered (did not bounce) then your delivery rate would be 95%.
Complaint rate is the rate a subscriber marks an email as spam.
Why do you need to measure complaint rates?
A consistently high complaint rate can have serious consequences on your deliverability and potentially get you into trouble with your email marketing provider.
An email return on investment determines how much money you make minus any costs. It calculates how profitable your email marketing efforts are.
Why do you need to measure ROI from emails?
Return on investment is used to calculate the effectiveness of an email marketing campaign. At the end of the day, if all your other email marketing metrics could be strong but if you’re not making a profit then you should look into your costs or your pricing model.
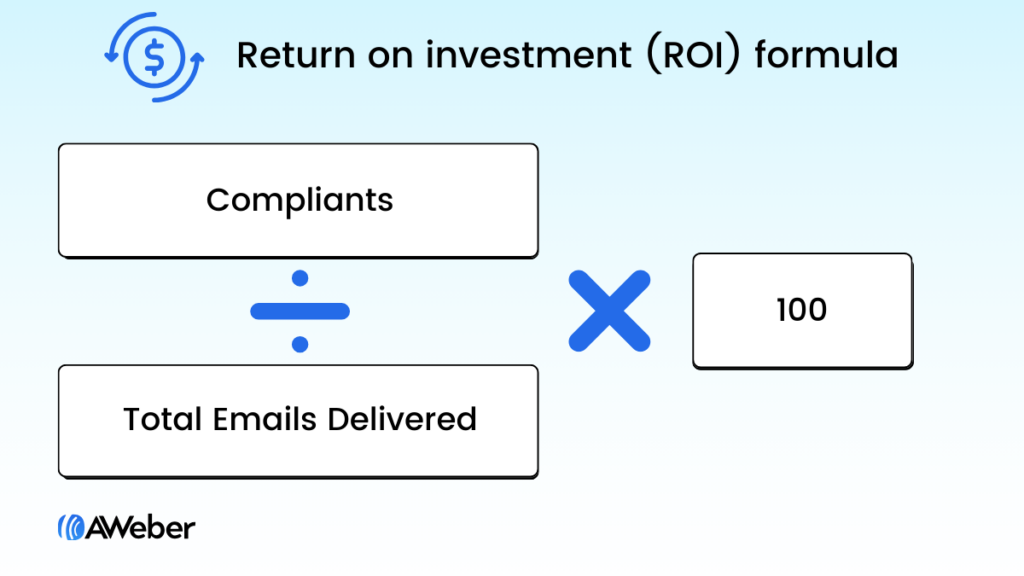
How to calculate ROI?
Email marketing return on investment (ROI) is calculated by taking the revenue earned from an email campaign, subtracting that amount by the amount spent, and finally dividing that number by the amount spent to get the ROI expressed as a percentage.
ROI example
If your total cost for an email campaign was $100 and you earned $4,000, then the ROI would be $39. So you would earn $39 for every $1 spent.
You can measure the success of your email marketing by determining the right KPIs to focus on. Your email metrics tell you a story about your customer’s engagement. Use that intel to discover opportunities to make improvements, deliver more value and increase the effectiveness of your emails.
Which email marketing metrics should you focus on
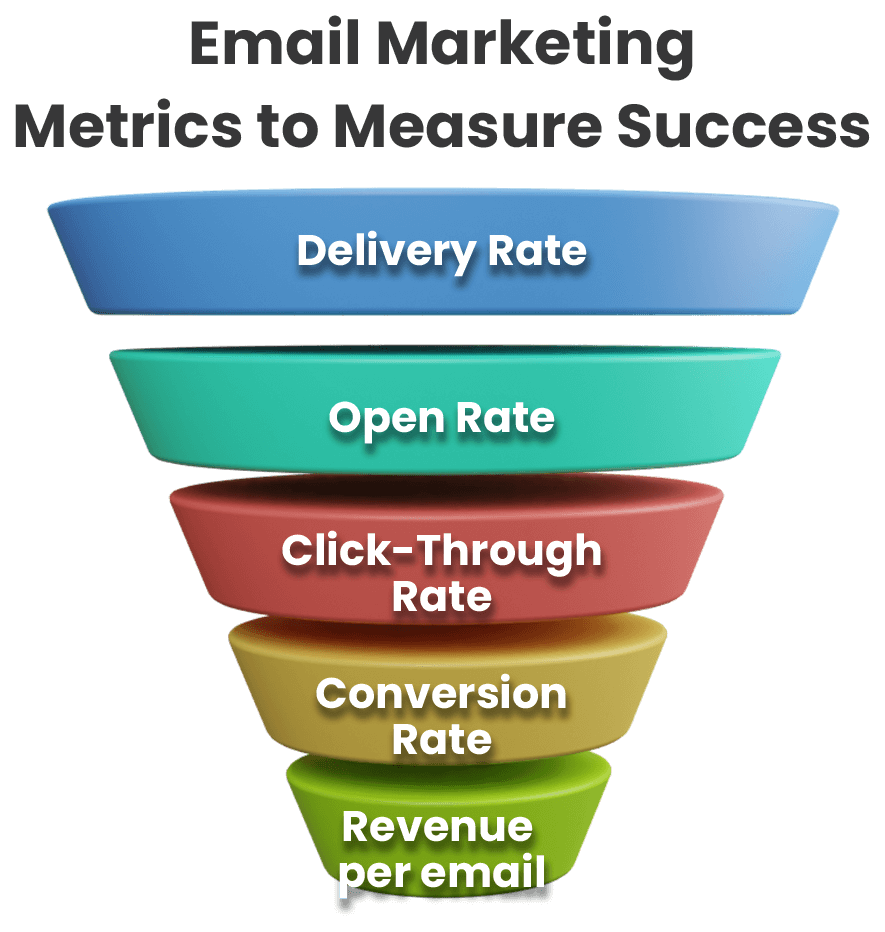
You need to be focusing on each email marketing metrics listed above. They all play an integral role in the performance of your email. This graph is an email marketing metrics funnel, it shows how each key performance metric could impact your overall performance.
For example, if your delivery rate or open rate are low, this will inevitably impact the available number of subscribers who would click on your email and ultimately convert.
Interpreting the data from your email analytics may seem daunting, but don’t be afraid to delve into it. You now have the information you need to focus your efforts
Like any other business strategy, analytics are the key to identifying success.
If you send an email out into the wild and don’t review the metrics, did it really happen?
Of course it did! But it does make it difficult to know what kind of impact your email had. Did a lot of subscribers open it? Did they click any links? Did they make a purchase as a result?
To answer these questions and discover if your emails are helping you connect with customers and grow your business, know which email marketing metrics also known as key performance indicators (or KPIs) to look for and why they are essential.
Table of contentsOpen rateClick-through rateClick-to-open rateSalesConversion rateUnsubscribe rateBounce rateSoft bounceHard bounceDelivery rateComplaint rateEmail return on investment (ROI)How do you measure success of email marketing
Open rate
What is an email open rate?
An email open rate measures the number of people who opened your messages.
Why do you need to measure open rates?
Your open rate can provide several insights into your email’s overall performance, including whether your subject lines are effective and the best times to email subscribers.
If your open rates aren’t as high as you want them to be, there are simple steps you can take to try to improve them.
For example, try emphasizing urgency in your subject lines to make them more compelling. Or, add specific details that tell subscribers exactly what they’ll get in your emails. Your goal is to stand out in the inbox, so you need to convince subscribers that your content is worth engaging with.
Low open rates could also mean that you’re not sending emails at an ideal time for your subscribers. Try sending your emails on different days and times.
With this insight, you can identify how you can get more people to view your emails.
How to calculate email open rates?
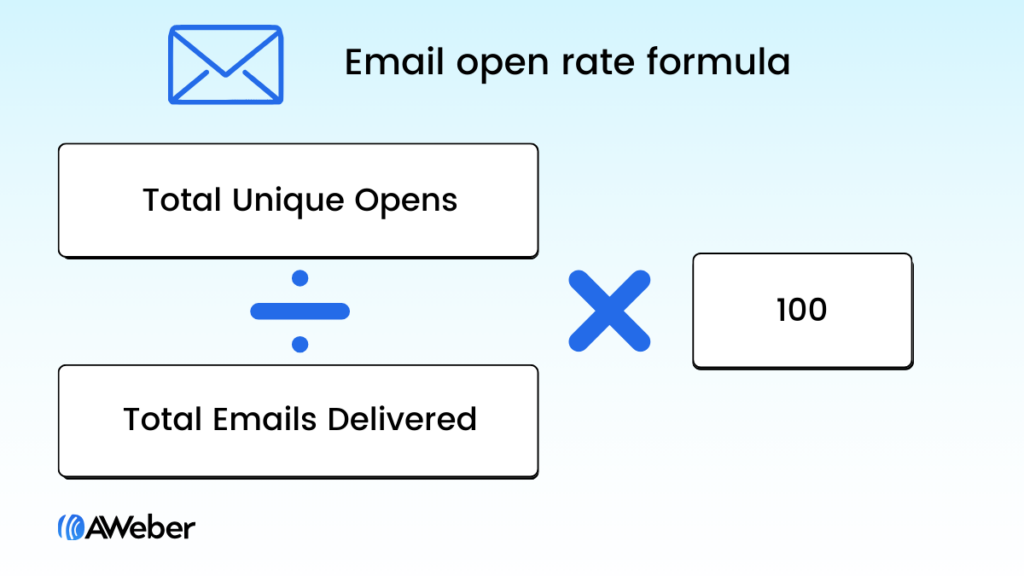
Open rates are calculated by taking the unique opens (i.e., the total number of unique subscribers who open your email) and dividing it by the total number of delivered emails.
Open rate calculation examples
If you send an email and it’s delivered to 1,000 subscribers and 300 of them open it, you would have a 30% open rate.
300 (Unique Opens) ÷ 1,000 (Emails Delivered) * 100 = 30% (Open Rate)
Click-through rate
What is an email click-through rate?
An email click-through rate measures the number of people who click on links or call to actions in your messages based on the number of people the email was delivered to.
Why do you need to measure click-through rates?
Your email click-through rate tells you whether or not your email content and call to action is relevant to your subscribers.
If you find your subscribers are opening your emails but not clicking the links within them, there are a few actions you can take to fix this issue.
For example, try different types of content. As you experiment with different types of content, make note of what works and what doesn’t. Create an email content calendar and keep track of the things your subscribers love most.
It’s also possible your low CTR is due to your call to action (CTA). Start testing different CTA copy to see if one works better than the other.
Segmenting subscribers and sending targeted emails can work wonders for improving the click-through rate in your emails.
The insight you gain from your click-through rate metrics can help you optimize the content of your emails.
How to calculate email click-through rates?
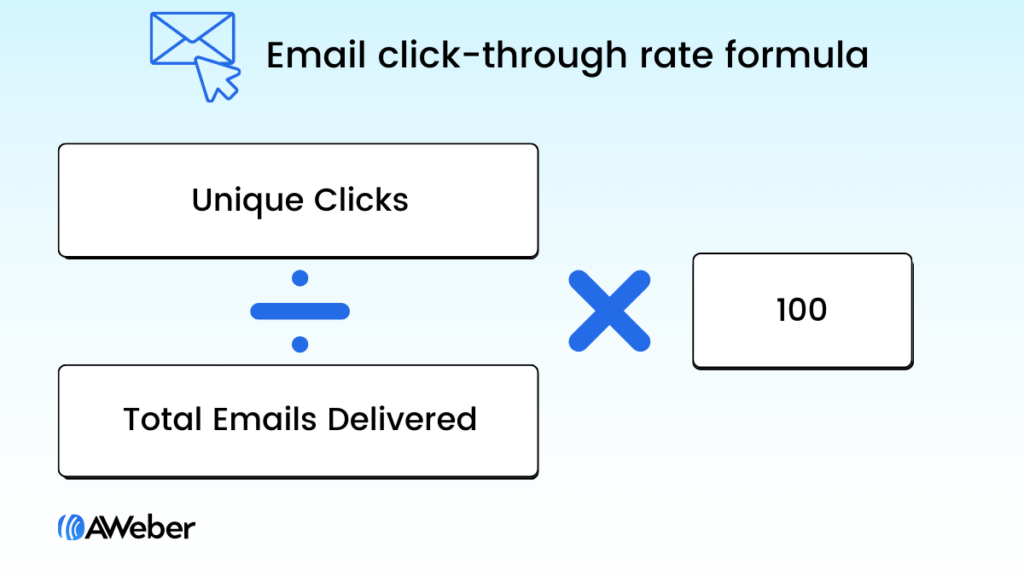
Click-through rates are calculated by taking the total unique clicks (i.e., the total number of unique subscribers who clicked on a link in your email) and dividing it by the total number of delivered emails.
Click-through rate example
If you send an email to 1,000 subscribers and 80 of them click on a link in it, you would have an 8% click-through rate.
80 (Unique Clicks) ÷ 1,000 (Emails Delivered) * 100 = 8% (Click-Through Rate)
Click-to-open rate
What is an email click-to-open rate?
An email click-to-open rate measures the number of people who click on links or call to actions in your messages based on the number of people who opened the email.
Why do you need to measure click-to-open rates?
To explain why you need to measure click-to-open rates, it helps to understand how click-to-open rates are different from click-through rates. Click-through rates divide unique clicks by the total number of emails delivered, where click-to-open rates divide clicks by unique opens.
Why is this significant? Because it takes those subscribers who didn’t open out of the equation. Now you’re looking at people who actually viewed your content. So now you can start identifying the impact of your content and call to actions in a silo.
How to calculate email click-to-open rates?
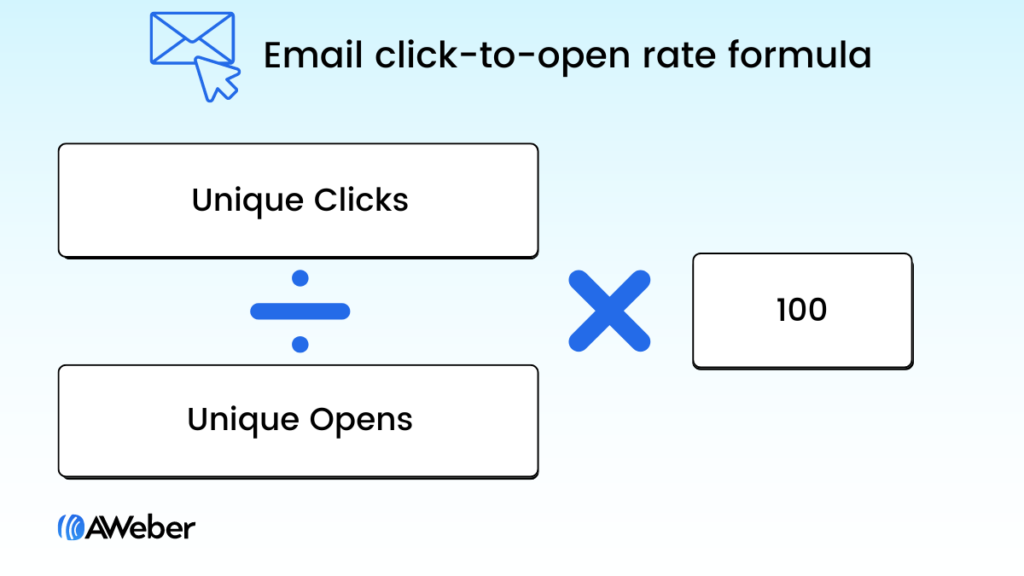
Click-to-open rates are calculated by taking the total unique clicks (i.e., the total number of unique subscribers who clicked on a link in your email) and dividing it by the total number of unique opens.
Click-to-open rate example
If 500 subscribers open your email and 150 of them click on a link in it, you would have a 30% click-to-open rate.
500 (Unique Clicks) ÷ 1,000 (Unique Opens) * 100 = 8% (Click-to-Open Rate)
Sales
What are email sales?
Email sales is the amount of money generated from an email
Sales are tracked by identifying who read an email and clicked through to your site and made a purchase.
Why do you need to measure sales from emails?
This ones pretty obvious – so you know how much money you make from your email marketing efforts.
Conversion rate
What are email conversion rates?
Your conversion rate is the percentage of subscribers who complete a goal from your email campaign.
Why do you need to measure conversion rates from emails?
This is a very important email marketing kpi because it indicates how effective your campaign is performing.
Your conversion rate can be influenced by several factors:
Email segmentation – are you sending the right offer to the right subscribers?
Call-to-action (CTA) – is the CTA in your email direct? Are you using action terms?
Landing page – is your landing page optimized to get the visitor to take a desired action?
How to calculate conversion rates?
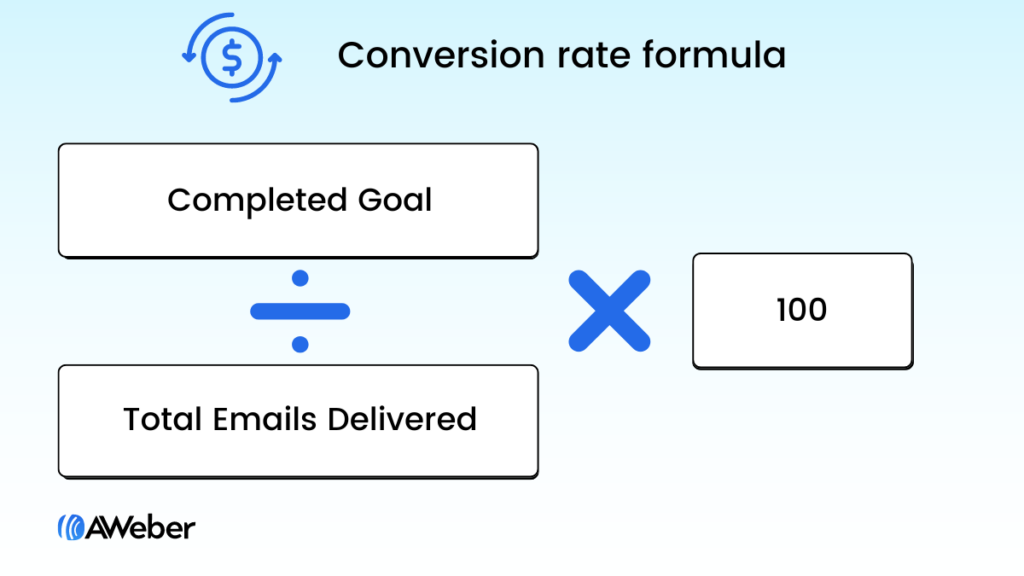
Email conversion rates are calculated by taking the number of conversions (subscribers who completed the desired goal) and dividing that number by the total number of emails delivered.
Conversion rate example
If you send an email which is delivered to 1,000 subscribers and 5 of them completed your goal (conversion), then you would have a conversion rate of 5%.
5 (Completed Goal) ÷ 1,000 (Emails Delivered) * 100 = 5% (Conversion Rate)
Unsubscribe rate
What is email unsubscribe rate?
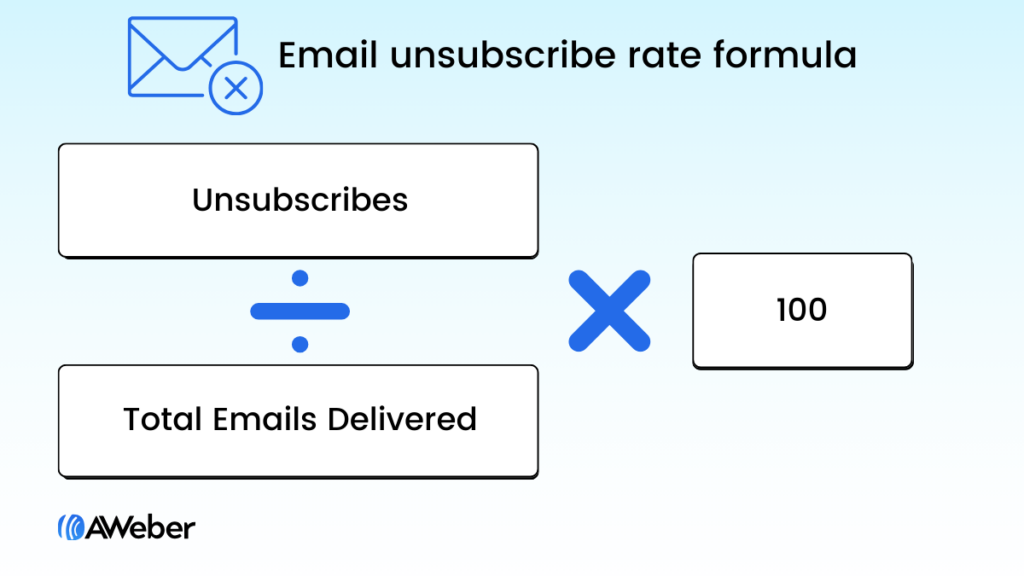
Email unsubscribe rate is the percentage of people who clicked on the opt-out link in a given email.
Why do you need to measure unsubscribe rates?
It’s a sad moment when you discover someone has unsubscribed from your email list. But it’s important to look at your unsubscribers from a new angle that seeks to understand the reasons why they left, and what you could do better to bring them back or prevent others from leaving.
How to calculate email unsubscribe rates?
Unsubscribed rate is calculated by dividing the total number of people who unsubscribed by the total number of emails delivered.
Unsubscribe rate example
If you send 1,000 emails and 10 people unsubscribe then your unsubscribe rate would be 1%.
10 (Unsubscribes) ÷ 1,000 (Emails Delivered) * 100 = 1% (Unsubscribe Rate)
Bounce rate
What is an email bounce rate?
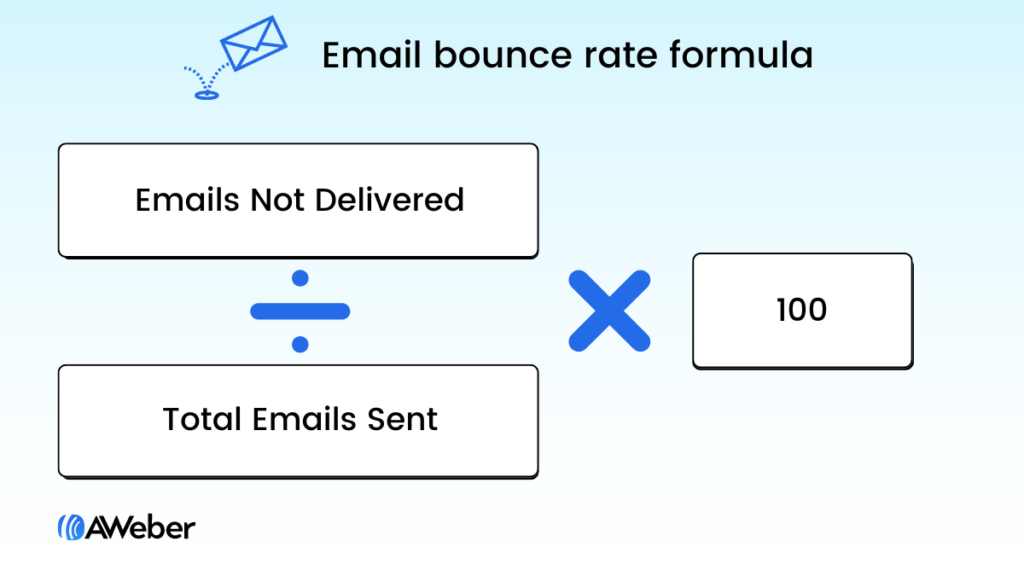
A bounce rate is the percentage of emails that failed to reach your subscriber because they are rejected by their mail server.
Why do you need to measure bounce rates?
A bounce rate is a good indication on the health of your email list.
Ideally, you want to aim for a bounce rate that is less than five percent. To do so, my advice is to maintain a clean, active and engaged email list.
How to calculate email bounce rates?
Bounce rates are calculated by taking the total number of bounces (emails not delivered) and dividing it by the total number of emails sent.
Bounce rate example
If you send 1,000 emails and 50 bounced (were not delivered) then your bounce rate would be 5%.
50 (Bounced Emails) ÷ 1,000 (Emails Sent) * 100 = 5% (Bounce Rate)
Soft bounce
What is an email soft bounce?
A soft bounce means a recipient’s email account is temporarily unavailable. This typically happens when a server is unavailable or a recipient’s inbox is full.
Most email marketing providers will continue to send to a soft bounce several times before automatically unsubscribing them from your email list.
How to calculate soft bounce rates?
Soft bounce rates are calculated by taking the total number of soft bounces and dividing it by the total number of emails sent.
Hard bounce
What is an email hard bounce?
A hard bounce means a recipient’s email account is closed or invalid. Most email marketing providers will automatically unsubscribe someone who hard bounces.
How to calculate hard bounce rates?
Hard bounce rates are calculated by taking the total number of hard bounces and dividing it by the total number of emails sent.
Delivery rate
What is an email delivery?
The receiving mail server accepted the email and delivered it to the mailbox. However, just because an email is “delivered”, does not mean that it reached your recipient’s inbox.
Your email delivery rate is the opposite of your bounce rate. If an email does not bounce then it is considered delivered.
Why do you need to measure delivery rates?
If you find that your email open rates are unusually low and spam complaints are high, there may be an issue with deliverability, which influences whether or not your emails make it into your subscribers’ inboxes.
There are several factors that influence the deliverability of your emails, but the best way to maintain a good email deliverability rate is by adhering to the CAN-SPAM Act and email marketing best practices.
According to the CAN-SPAM Act, a U.S. law that regulates commercial emails, senders must:
Include a way for subscribers to unsubscribe
Contain the sender’s valid postal address
Be clear about who is sending the email
Label the message as an advertisement
Avoid misleading subject lines
How to calculate delivery rates?
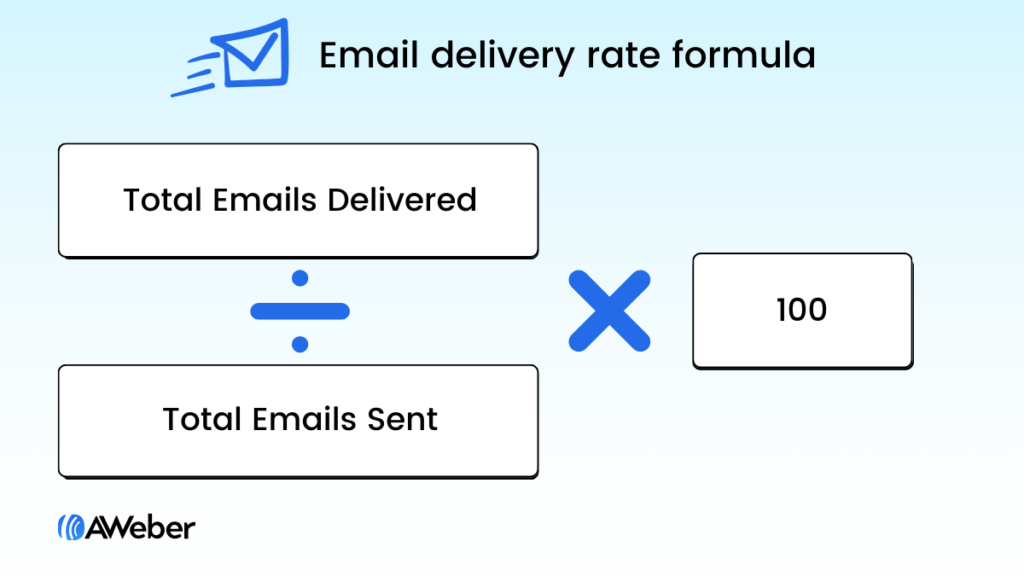
Delivery rate is calculated by dividing the number of emails sent by the number of emails delivered.
Delivery rate example
If you send 1,000 emails and 950 were delivered (did not bounce) then your delivery rate would be 95%.
950 (Delivered Emails) ÷ 1,000 (Emails Sent) * 100 = 95% (Delivery Rate)
Complaint rate
What are email complaint rates?
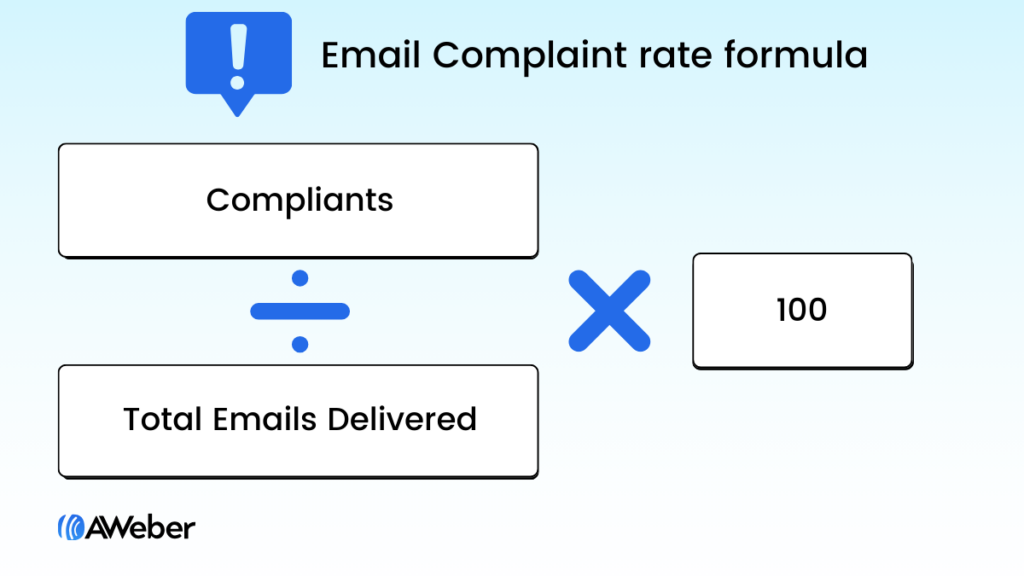
Complaint rate is the rate a subscriber marks an email as spam.
Why do you need to measure complaint rates?
A consistently high complaint rate can have serious consequences on your deliverability and potentially get you into trouble with your email marketing provider.
Sticking to email marketing best practices will help you maintain a low complaint rate.
How to calculate complaint rates?
Your complaint rate is calculated by taking the total number of complaints and dividing it by the total number of emails delivered.
Complaint rate example
If you send 1,000 emails and 1 person complains then your complaint rate would be 0.1%.
1 (Complaints) ÷ 1,000 (Emails Delivered) * 100 = 1% (Complaint Rate)
Email return on investment (ROI)
What is an email return on investment?
An email return on investment determines how much money you make minus any costs. It calculates how profitable your email marketing efforts are.
Why do you need to measure ROI from emails?
Return on investment is used to calculate the effectiveness of an email marketing campaign. At the end of the day, if all your other email marketing metrics could be strong but if you’re not making a profit then you should look into your costs or your pricing model.
How to calculate ROI?
Email marketing return on investment (ROI) is calculated by taking the revenue earned from an email campaign, subtracting that amount by the amount spent, and finally dividing that number by the amount spent to get the ROI expressed as a percentage.
ROI example
If your total cost for an email campaign was $100 and you earned $4,000, then the ROI would be $39. So you would earn $39 for every $1 spent.
$4,000 (Revenue) – $100 (Spend) ÷ $100 (Spend) = $39 (ROI)
How do you measure success of email marketing
You can measure the success of your email marketing by determining the right KPIs to focus on. Your email metrics tell you a story about your customer’s engagement. Use that intel to discover opportunities to make improvements, deliver more value and increase the effectiveness of your emails.
Which email marketing metrics should you focus on
You need to be focusing on each email marketing metrics listed above. They all play an integral role in the performance of your email. This graph is an email marketing metrics funnel, it shows how each key performance metric could impact your overall performance.
For example, if your delivery rate or open rate are low, this will inevitably impact the available number of subscribers who would click on your email and ultimately convert.
Interpreting the data from your email analytics may seem daunting, but don’t be afraid to delve into it. You now have the information you need to focus your efforts
Like any other business strategy, analytics are the key to identifying success.
Keep reading:14 Types of landing pages: What each one does and when to use itHow to use the psychology of color in marketing to increase your results
 87% off ends soon!