Do You Know How Your Email Open Rate Is Calculated?

Okay, I admit that this isn’t the most exciting topic when it comes to email marketing. You want your data, and you don’t care too much about how it’s obtained.

But it is important to consider if you’ve switched (or are thinking of switching) email marketing service providers (ESP). And here’s why: not all ESPs calculate email open rates the same way, and that can change your view on how your emails are performing.


Where ESPs and pizza places intersect

Switching to a new email marketing provider is kinda like finding a new pizza spot. Even though you have a whole new menu, you still expect certain elements to be the same. But then you realize your new pizza hangout creates their sauce differently, and nothing makes sense anymore. Even though it’s still pizza, something just seems off in comparison.

Well, moving to a new email marketing platform can be a similar experience, such as when you start reviewing your open rates on recently sent emails. Just like how no two pizza places follow the same recipes for the same pies, not every ESP uses the same formula for calculating open rates.

While this won’t impact how many people are opening your emails, it can portray different pictures of how successful your emails are.

But first, what’s an open rate?

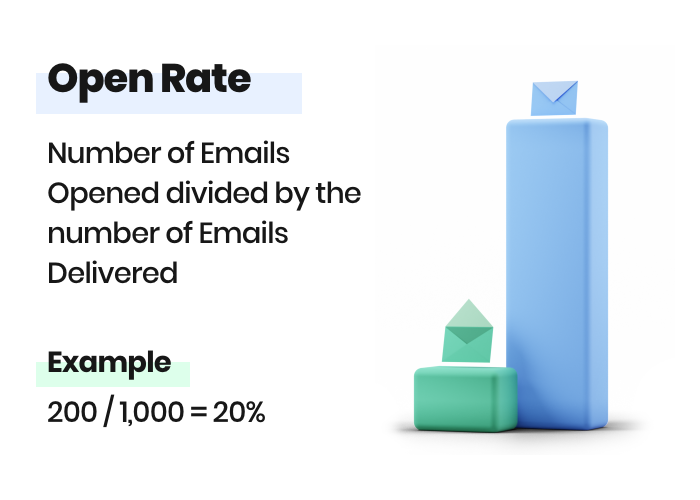
Open rates represent the percentage of subscribers who opened your email compared to the number of emails that were delivered.

To track opens, ESPs that provide analytics add an invisible tracker image within HTML emails. As long as the email is opened using a provider that doesn’t block images, the open rate will be tracked.

This data is helpful as it provides insight into how effective your subject lines are at convincing subscribers to open your emails. It can also tell you the best times to send emails to your subscribers; if your open rates are higher between 2 pm and 5 pm on Wednesdays than any other time of the week, you might want to start sending future emails during that time.

How open rates are calculated

While ESPs track opens the same way, the road begins to split when it’s time to calculate the open rate. Here are the three most used formulas:

1. Unique Opens / Total Number of Subscribers

This approach (which we use here at AWeber) means the open rate is calculated by taking the unique opens (i.e., the total number of unique subscribers who open your email) and dividing it by the total number of subscribers on your list. So regardless of how many times a single person opens your email to look back at its contents, it will only count as one open.

For example, if you send an email to 100 subscribers and 20 people open it, your open rate would be 20 percent.

2. Total Opens / Total Number of Subscribers

With this formula, one person might count as multiple opens if they open your message more than once. Let’s go back to your email you sent to 100 people. Now, if 20 people open your message, and one person opens your message five times, the open rate would be 25 percent using this formula.

So even though the same number of individuals read your message as the previous example, the results are quite different since total opens are referenced. And this has a couple of pros and cons:

Con: The disadvantage with this number is that your rates might be skewed higher than normal if someone opens up your email a number of times.

If you were to send out an email with a link to a new ebook, someone who isn’t ready to read the whole thing might go back to that email multiple times to grab the link. Someone, or multiple people, might be re-opening your email 10, 15, or even 20 times! As a result, your open rate might seem as though more people are opening your emails, when it’s really just the same few individuals.

Pro: Total opens can also tell you more about how engaged your subscribers are with the content in a particular email. If someone goes back to your email 10 or more times, there’s something about the content that urges them to do so.

3. Unique Opens / (Emails Sent – Emails Bounced)

Sometimes your emails never get opened because they don’t make it to your subscriber’s inbox in the first place. Emails bounce due to a number of reasons, like an invalid user, invalid domain name, permanent bounce backs, etc. As a result, some ESPs calculate open rates by excluding the number of emails that bounce from an Internet Service Provider (Gmail, Yahoo!, AOL).

Let’s say you send your email to 100 people, 20 people open it, one person opens it 5 times, and 9 emails bounce. Your open rate will be calculated as follows:

20 / (100-9) = 22% open rate

You’ll notice that this open rate is again different from the previous two results. Depending on how many emails bounce, this formula might present a slightly higher open rate as the number of recipients who received your email gets smaller.

So, what’s the best approach?

That’s sort of a trick question, because there is no single right way to calculate open rate. Each formula will paint a slightly different picture of how your emails are performing, and being aware of what the story is telling you is the first step to understanding your analytics.

To get deeper into the data and learn more about how your subscribers are interacting with your emails, check to see if your ESP provides more in-depth reporting. AWeber users, for example, can view breakdowns of both unique and total opens for sent emails. This allows you to gather more insight in addition to the percentage that is presented to you.

How are your open rates calculated?

Check with your email service provider to see how your open rates are being calculated. If you’re planning on switching to a new ESP, be sure to research how they determine the rate as well.

For more tips on how to improve your open rates, here’s another great read from our blog.

Have any questions about open rates? Ask away in the comment section!