The 7 Survey Emails That Will Upgrade Your Marketing
By Liz Willits March 22, 2022
There’s a reason top marketers send survey emails so frequently — they work.
Survey emails can decrease unsubscribes, increase engagement, and help you sell more products or services. How? Because once you know exactly what your subscribers want, then you know what to give them. No more guessing about “would they like this thing, or that thing?” Just ask them with a survey email.
We’ll cover seven types of survey emails that will make your marketing much more effective. We’ve also included a few survey email examples from industry experts.
1. Welcome email survey
Getting feedback from your audience is so important that many experts include a survey or question in the first email they send to every subscriber — the welcome email.
Related: How to Write the Perfect Welcome Email
Welcome survey email examples
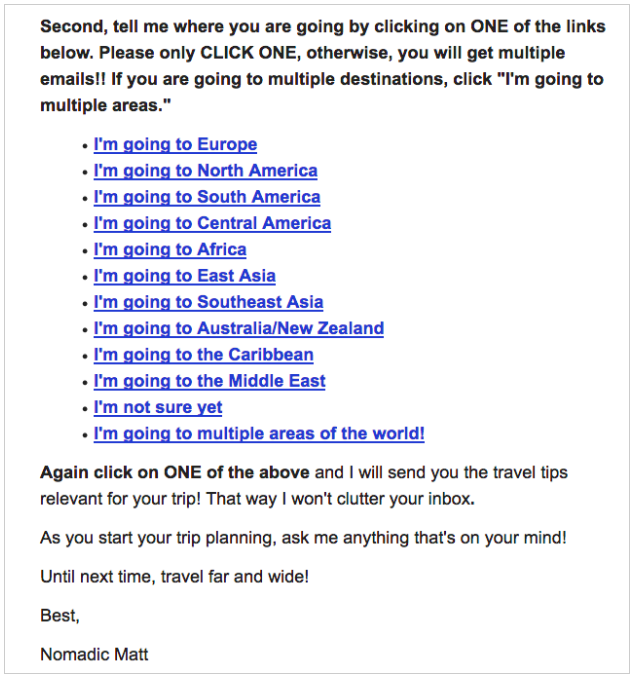
Matt Kepnes, founder of travel company Nomadic Matt, sends a welcome email survey. It’s a very “low tech” survey, but it works well. Matt just asks subscribers to click on a link to tell him where they want to travel.
After they click, he sends them personalized travel advice that matches their choice. For example, if a subscriber chooses Europe, he sends them content exclusively about Europe. He can send personalized emails like this because AWeber lets him send a specific email message based on which link a subscriber has clicked.
You can even survey your audience by just asking them to reply to your email. In the message below, Ann Handley, the Chief Content Officer at MarketingProfs (and an AWeber customer), asks her audience to respond to her email to let her know what they want to learn.
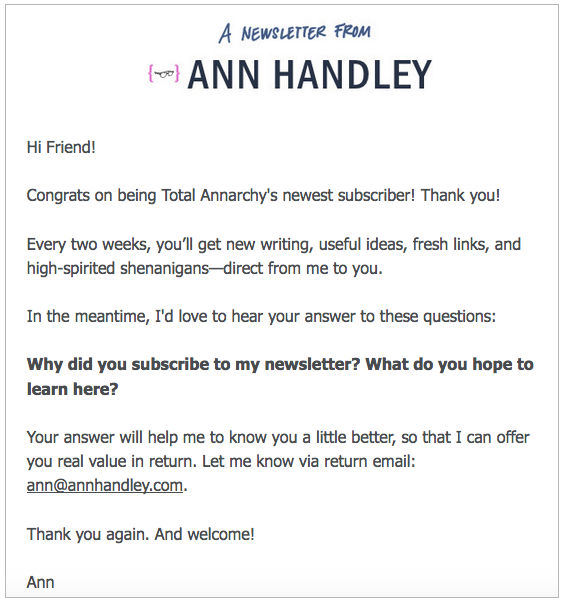
How simple is that?
Pro tip: To encourage more subscribers to complete your survey, keep the survey short. Aim for a survey that can be completed in three minutes or less. In your email, mention that it will only take a few minutes to complete.
Here’s how CoSchedule includes how long it takes to complete their email survey:
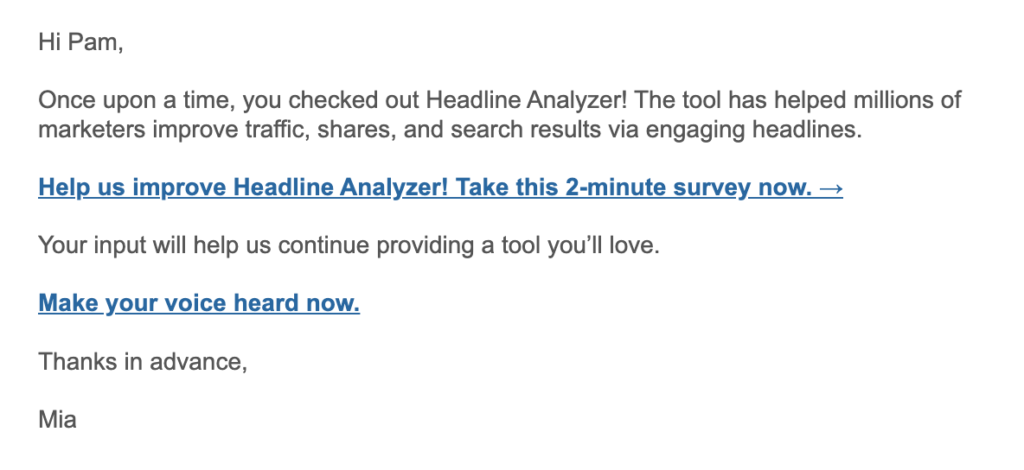
Why do this? Because longer surveys are completed less often. Think carefully: What do you really want to know? (What information would make the most difference to your business?)
2. The pre-launch survey email
You could spend hours creating something only to find out your audience doesn’t like it. To avoid this, send a pre-launch email marketing survey to ask your audience’s opinion before you decide what to sell.
Pre-launch survey email examples
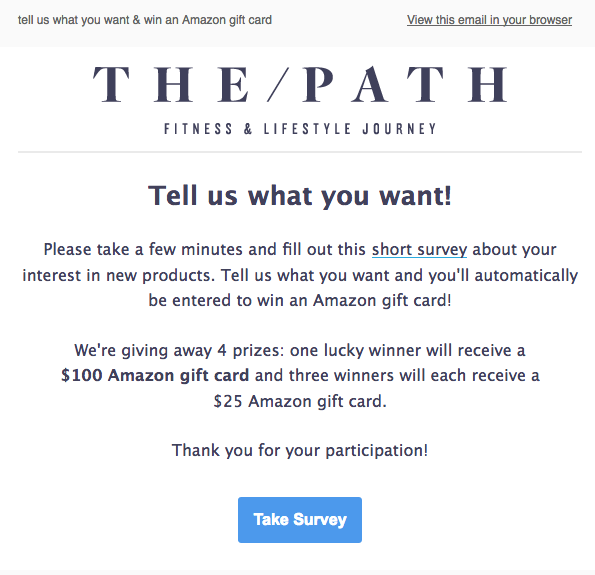
This example of a pre-launch survey email from The Path asks subscribers to tell them what kind of new products they’d like.
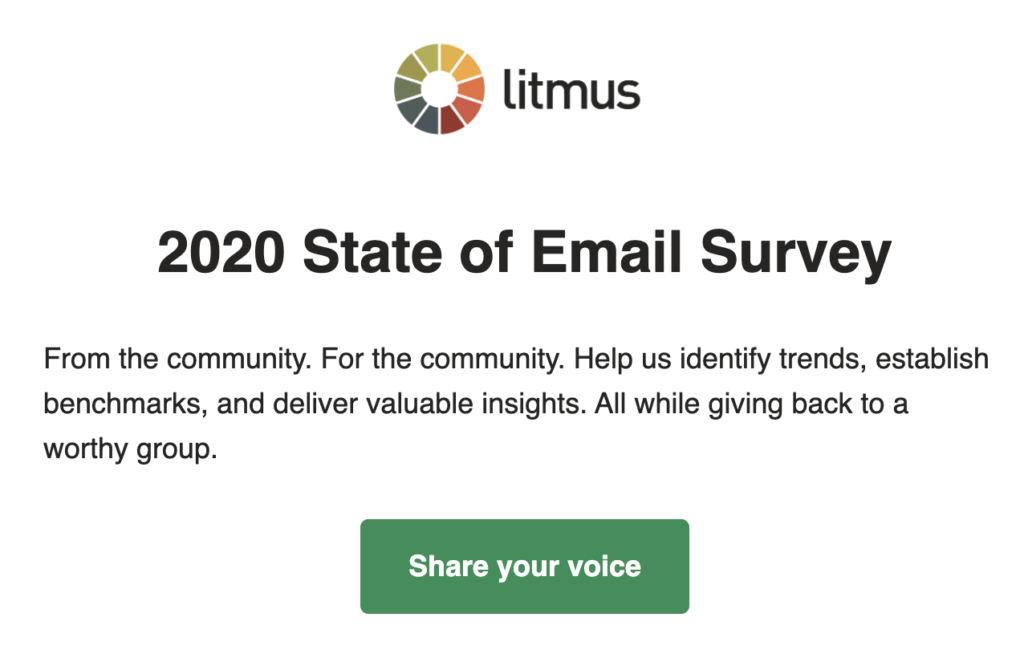
Pro tip: Explain how you’ll be using the survey feedback you receive. This can get more people to complete your survey.
When Litmus asked their subscribers to complete a survey, they described it as an opportunity to help establish industry benchmarks and to identify key trends.
.
3. Post-purchase email
Want to know what your customers think of your product or service after they purchase? Send them a survey.
Post-purchase survey email examples
In the post-purchase survey email below, Old Navy thanks subscribers for purchasing and asks them to complete a five-minute survey to share their feedback. As a thank you for completing the survey, Old Navy offers them a 10 percent discount on their next purchase.
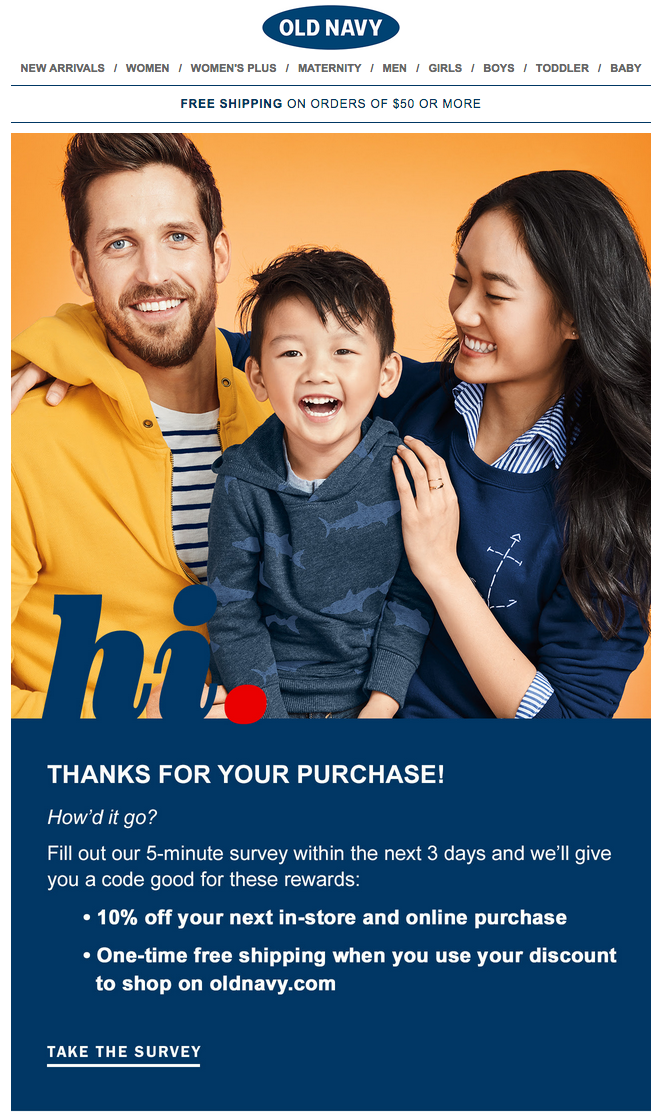
Pro tip: Incentivize subscribers to complete your survey by offering a discount on your product or service in exchange for completing it.
4. Data survey email
It can be a huge effort to collect data for a report, guide, or infographic. Subscriber survey emails make it much easier.
Data collection survey email examples
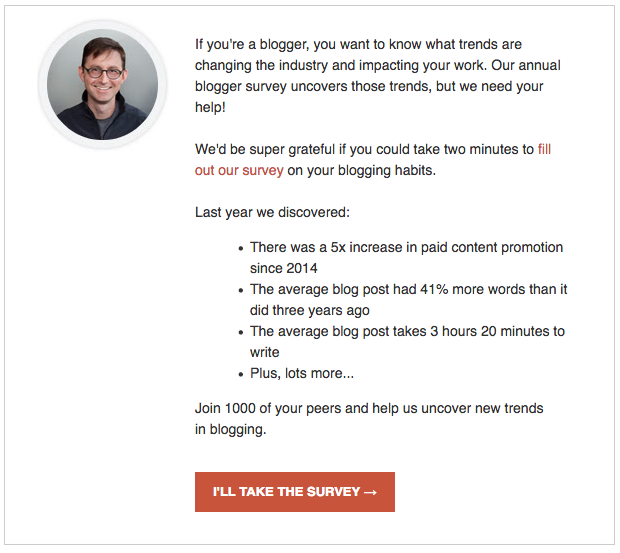
Andy Crestodina, the founder of Orbit Media, publishes a yearly report on blogging trends. To gather data for the report, he emails his audience a survey asking them to answer questions about blogging.
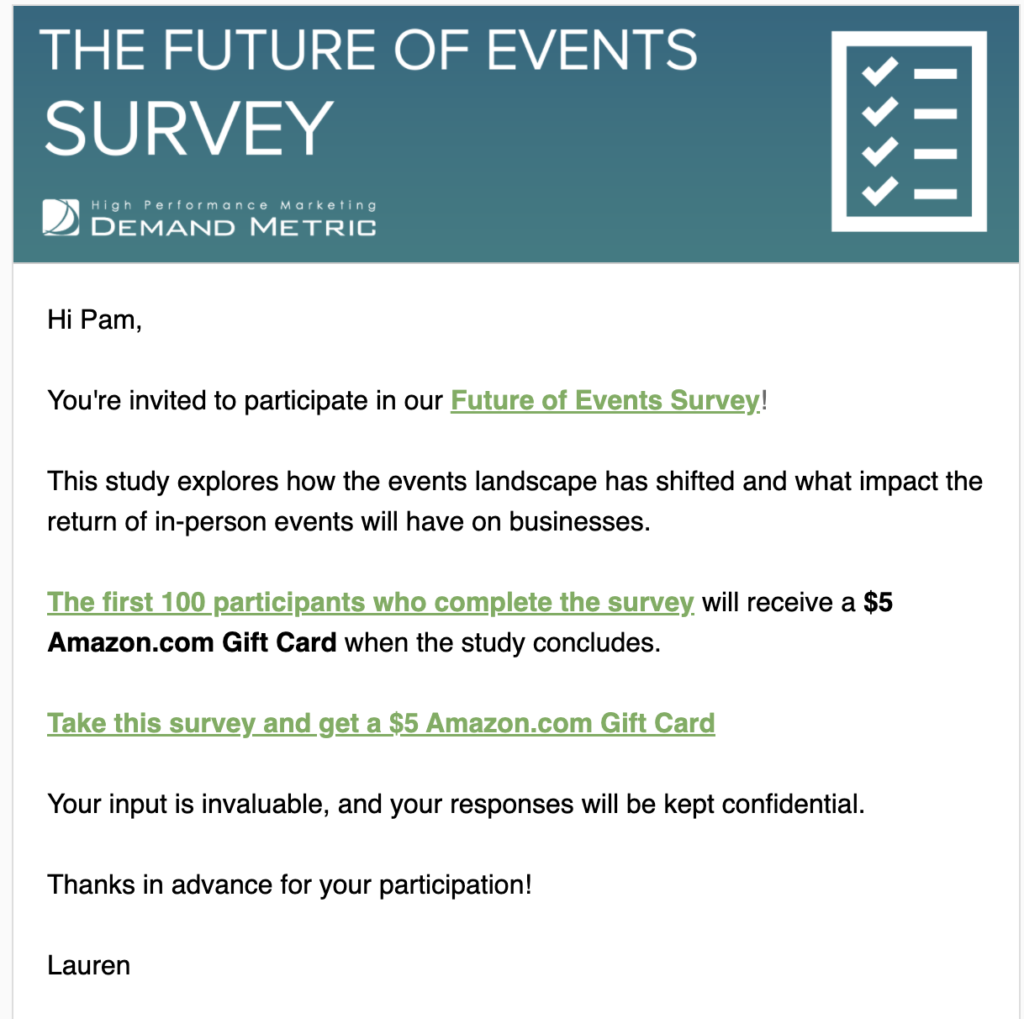
Pro tip: If you need to send a longer survey, be sure to give your subscribers a reason to complete it. Consider offering a large prize to a randomly-selected winner or smaller prizes to everyone who completes the survey.
Here’s how DemandGen uses this tactic.
5. Customer satisfaction survey
Check in on your customers from time to time to make sure they are satisfied with your company. A simple one-question survey is all you need. Create a baseline score after your first survey and set company-wide goals to improve this score.
Customer satisfaction survey email example
TDBank sends an annual survey asking their customers to rate their overall satisfaction on a scale from 1 (not at all) to 10 (strongly agree).
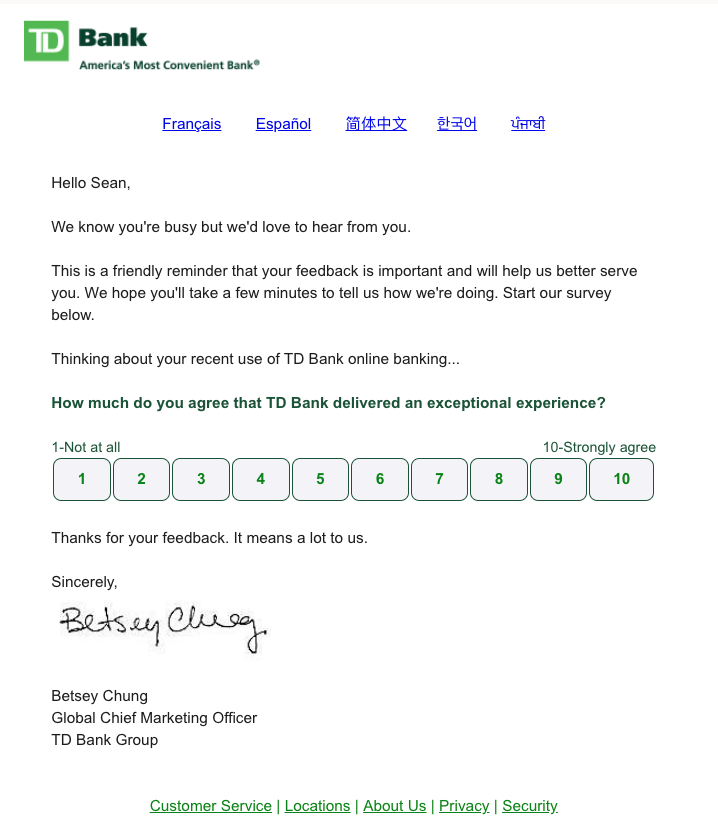
Pro tip: Set up your survey directly in your email using AMP. This will allow your subscribers to respond to the survey without leaving their inbox.
6. Email footer survey
Find out whether or not your subscribers like your email content with a simple survey. Just add a one-question survey to the end of your emails to ask for their opinions.
Email Footer survey email example
We add a footer survey to nearly every email we send at AWeber. Subscribers simply click a happy or sad emoji face to tell us how they felt about the email.
Related: Here’s How We Got 1,600+ People to Give Us Email Feedback
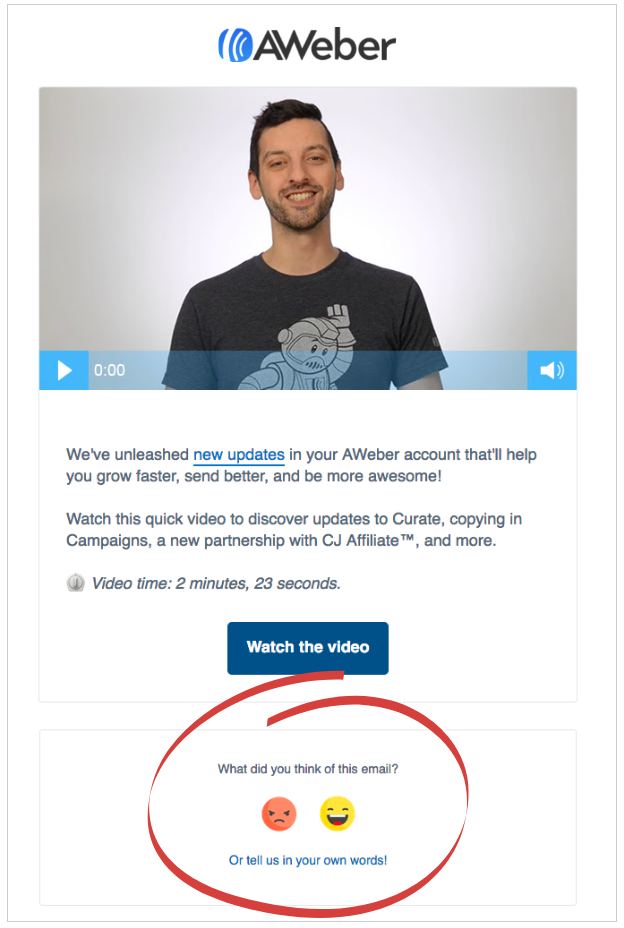
Pro tip: You can easily add a survey like this to your own emails using AWeber’s 4 survey templates.
7. Webinar feedback survey
Want to know what people really thought about your webinar? Ask them to share their thoughts.
Jotform Webinar Manager Morgan Ziontz does this with the help of Jotform’s 400+ feedback templates.
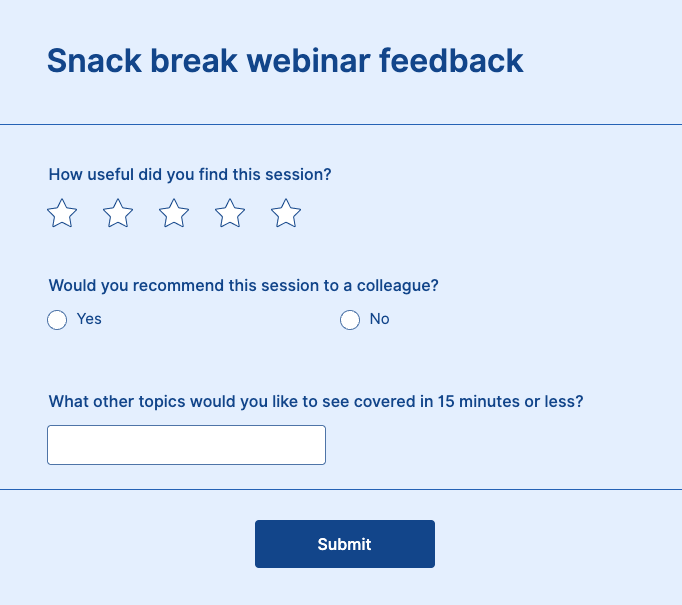
Pro tip: Double the benefits of your webinar feedback surveys by asking about which additional topics your attendees want you to cover. Not only will this encourage viewers to return for a future session, but you’ll ensure that your webinar calendar reflects the content that matters most to your audience.
What is a good response rate for an email survey?
So once you’ve got your survey ready, what kind of response rate can you expect? According to SurveyAnyplace, the average response rate for an email survey is 33%.
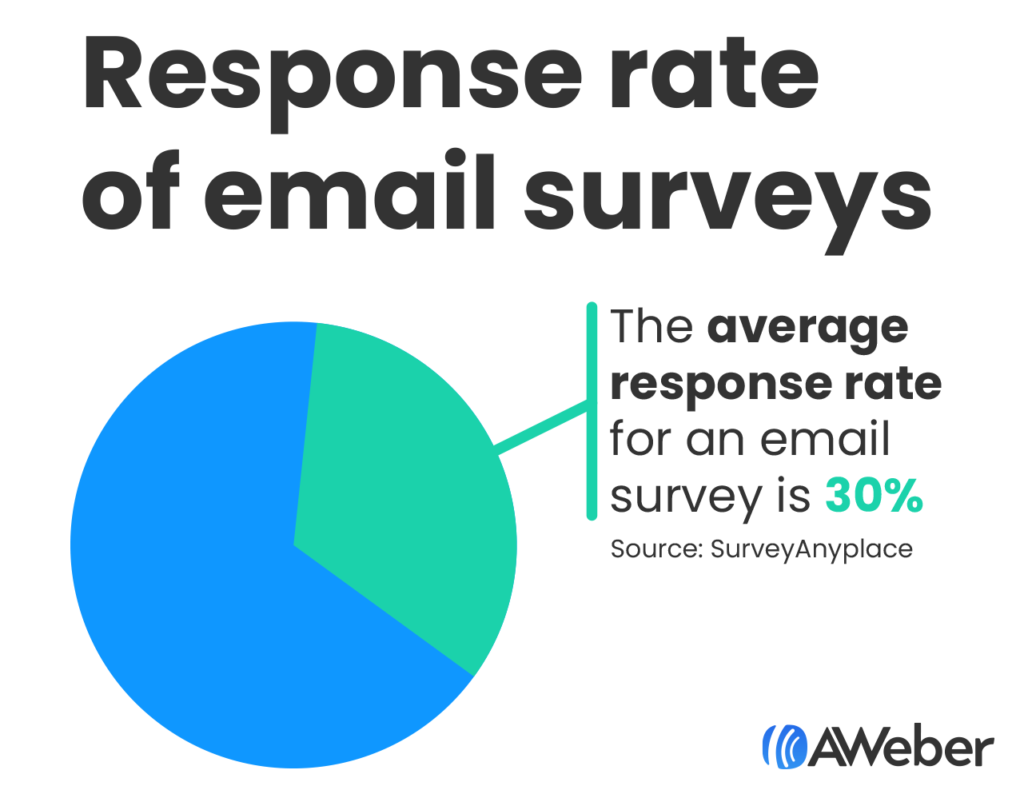
This goes to show that if you ask, a good portion of your audience will be happy to provide their feedback.
Ask questions. Get answers.
Survey emails are great for gathering useful information about your subscribers that can help you increase email engagement and market your business.
Lee Lo
7/27/2017 5:15 amHow many questions are too many? I need at list a couple of questions to find out what they think. I am talking about post purchase email survey. And I would love to get a clear answer that I can use as testimonial. How about that?
Liz Willits
10/11/2017 4:33 pmHi Lee,
I recommend keeping your survey under 5 questions. Ideally, it’ll be 2-3 questions. If your questions are multiple-choice and simple, you may be able to get away with including more than 5 questions.
Let me know if you have any additional questions.
Mike
7/27/2017 8:34 pmHi Liz, I’ve always been a little wary of sending out a post purchase email survey as I thought it would potentially overload the purchaser.
I really like the idea of offering the purchaser an incentive though and I can see how the Old Navy example could work. I will certainly think about trying it in the future.
Liz Willits
10/11/2017 4:31 pmHi Mike!
Thanks for reading my post. And yes, post-purchase emails could possible overwhelm your subscribers. I recommend sending a post-purchase email a few days or even a week after their purchase. That way, they’ve had some time after their purchase to try the product, and they won’t receive multiple emails in their inbox at once.
Prakash, Digital Marketing Consultant
7/28/2017 2:08 amHi Liz Willits,
I found aweber extremely useful for email marketing. It helped me extremely boost our traffic and have increased our webinar subscribers with whooping 70% nearly. Thought of sharing with you. If you really interested, I can share you with our case. You can write a case study about our success strategy.
Of Course, your email marketing templates are good and useful too but if you could write based on some researches and numbers on how to improve the click through of email campaigns.